Yet another "Java faster than C++" claim
• cpp
Some days ago, a friend emailed me desperated because a Java code was faster than his C++ implementation. These Java faster than C++ claims were very common when Java was the tech companies fashion language. I never liked Java because I always thought it was quite verbose (however, I never tried the new functional constructions in Java 8) and used to be very heavy. I mean, I could recognize that an app was written in Java in a blink of eyes, just by looking how slow it was. Things have changed since, but as I was never a professional Java programmer, I didn’t follow the language evolution.
Back to the post, the code in question is a Huffman code implementation. He based his C++ implementation on Sedgewick’s Java version. If you want to profile on your own, you can clone his repo (as he already merged my patches, you’ll need to rewind git history a bit to profile the old code). You can find instructions on how install the Java code here.
Let’s get it started by using the simple time command. In this test, we are measuring the time to compress and decompress the sample mobydick.txt file. First let’s profile the compression and decompression times for the Java version:
$ time java edu.princeton.cs.algs4.Huffman - < mobydick.txt > modydick.dwc

real  0m0.223s
user  0m0.255s
sys 0m0.034s

$ time java edu.princeton.cs.algs4.Huffman + < mobydick.dwc > mobydick.txt

real  0m0.186s
user  0m0.196s
sys 0m0.035s
Now, the C++ implementation:
$ time ./Huffman -e < mobydick.txt > mobydick.dwc

real  0m0.380s
user  0m0.364s
sys 0m0.009s

$ time ./Huffman -d < mobydick.dwc > mobydick.txt

real  0m0.352s
user  0m0.330s
sys 0m0.010s
Just for the record, I profiled the second execution of each command to make sure results won’t differ because of file caching.
Ok, C++ implementation is indeed slower, the question is why? After a rough look at the source code, the heap allocations were quite suspicious, but after some experiments I realized this was not the case, then I started to profile the code. If you know me, you also know I am a very keen Linux user, but I had to switch to Mac OS X for a project I am working on at Mozilla. As I have no much experience on Mac development, and that includes native tools, I made some google research and came across Instruments. After some painful time trying to use it inside Xcode, I came back to google and found iprofiler. That was a life saver, I could profile from command line and see the results on Instruments GUI. Instruments come with a set of Profiler templates, the one of interest here is the time profiler, which as its name says, profiles the time spent on function calls. Let’s start by profiling the compression operation:
$ iprofiler -timeprofiler -I 100us bin/Huffman -e < mobydick.txt > mobydick.bwc
And now let’s look at the results:
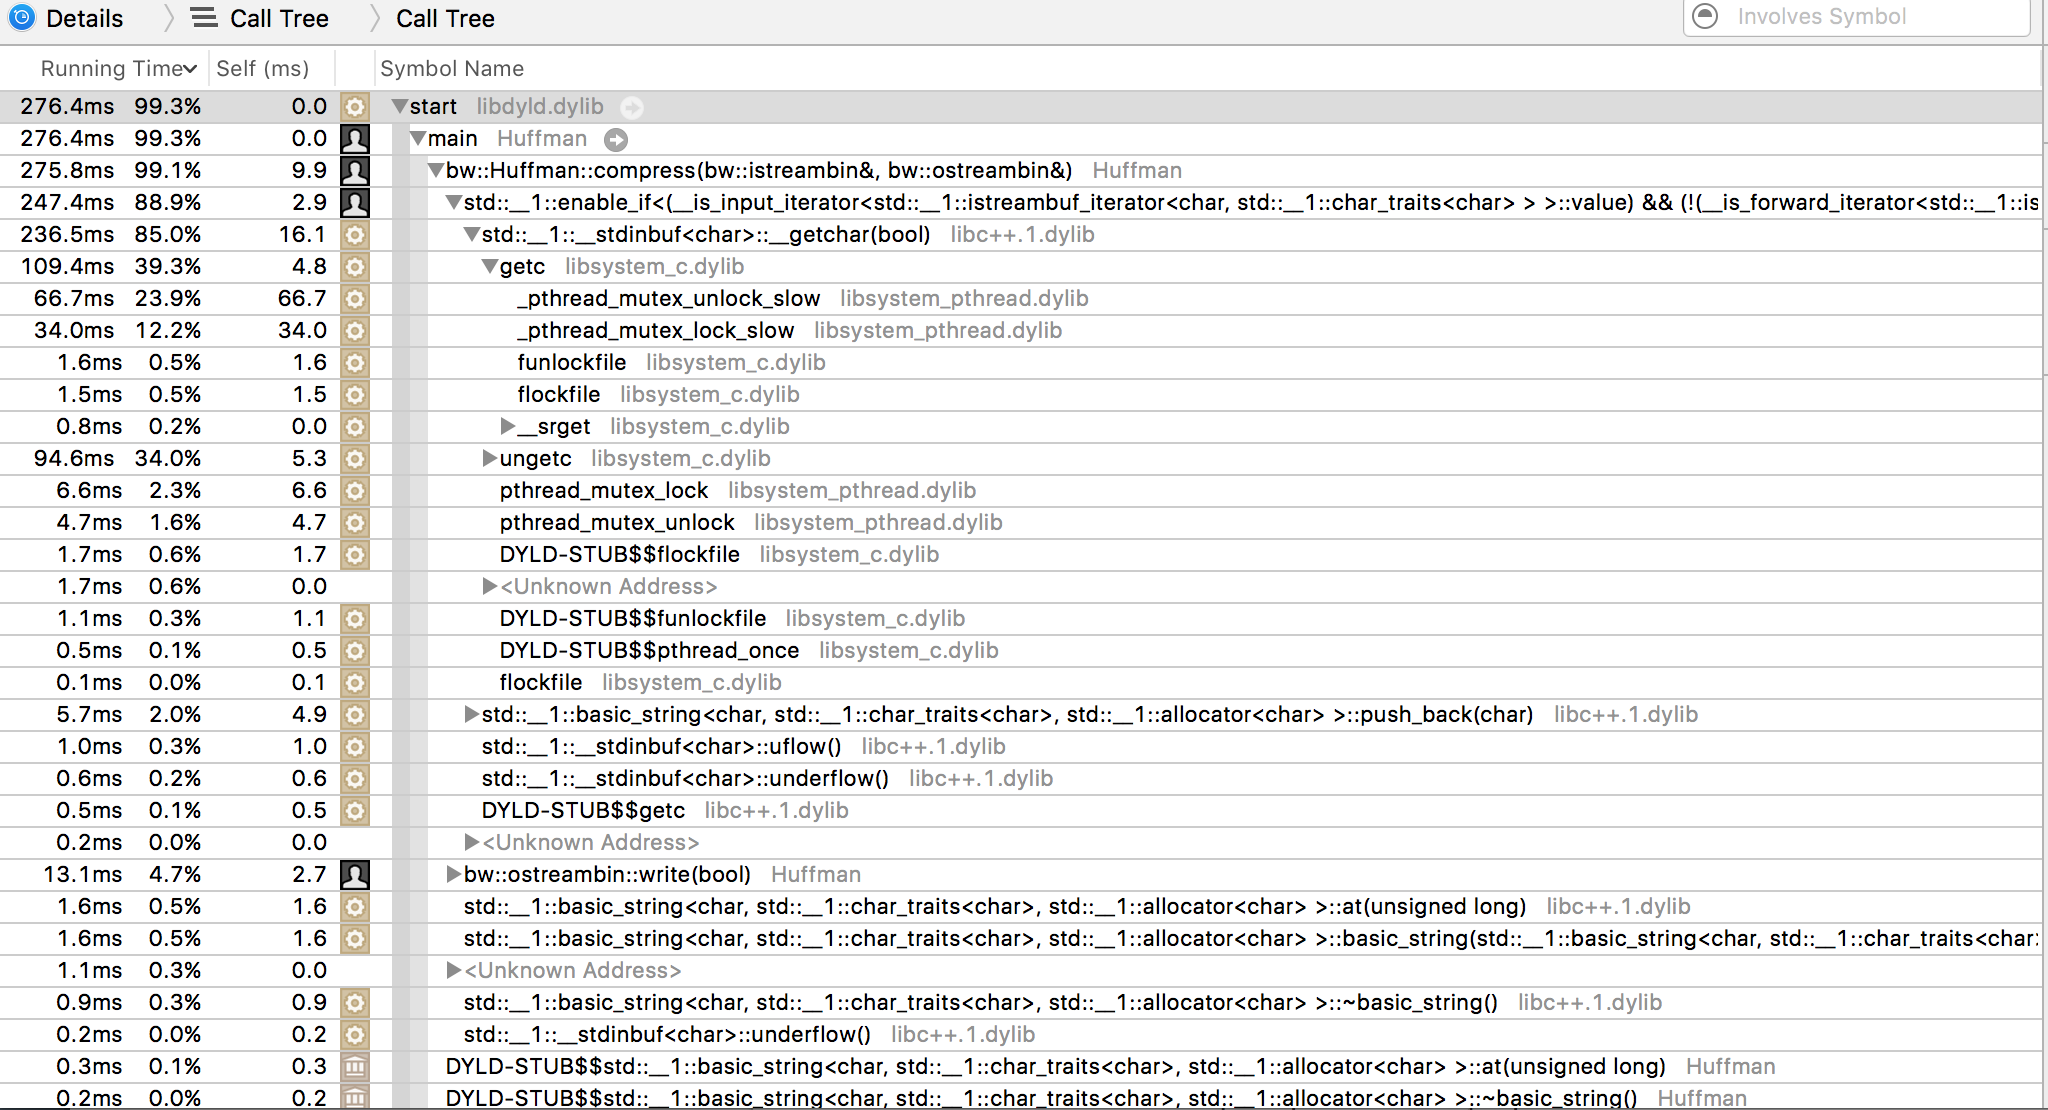
The program spends most of the time reading the input file. Why that? Here is a simplified version of the code that reads the input file:
std::string data(
    std::istream_iterator<char>(std::cin),
    std::istream_iterator<char>()
);
The problem lies on using std::cin to read the file. ISO C++11 says that standard streams objects must be thread safe, that means a mutex lock/unlock operation is executed each time the internal I/O buffer is accessed. In the code above, a mutex is locked for each character read, which makes things painfully slow. The solution is to use a std::fstream object, as it has no imposed lock contention. Obviously, all this applies to file writing as well, and we take the same path of replacing std::cout by std::fstream.
Now let’s see how much we improved compression and decompression performance:
$ time bin/Huffman -e < mobydick.txt > mobydick.bwc

real  0m0.108s
user  0m0.095s
sys 0m0.007s

$ time bin/Huffman -d -o mobydick.txt -i mobydick.bwc

real 0m0.215s
user 0m0.201s
sys  0m0.007s
250% faster for compression and 63% for decompression!!!

Can we make this better? Hrm, lets profile it one more time, but this time, we will profile decompression, since it is still slower than its Java counterpart:
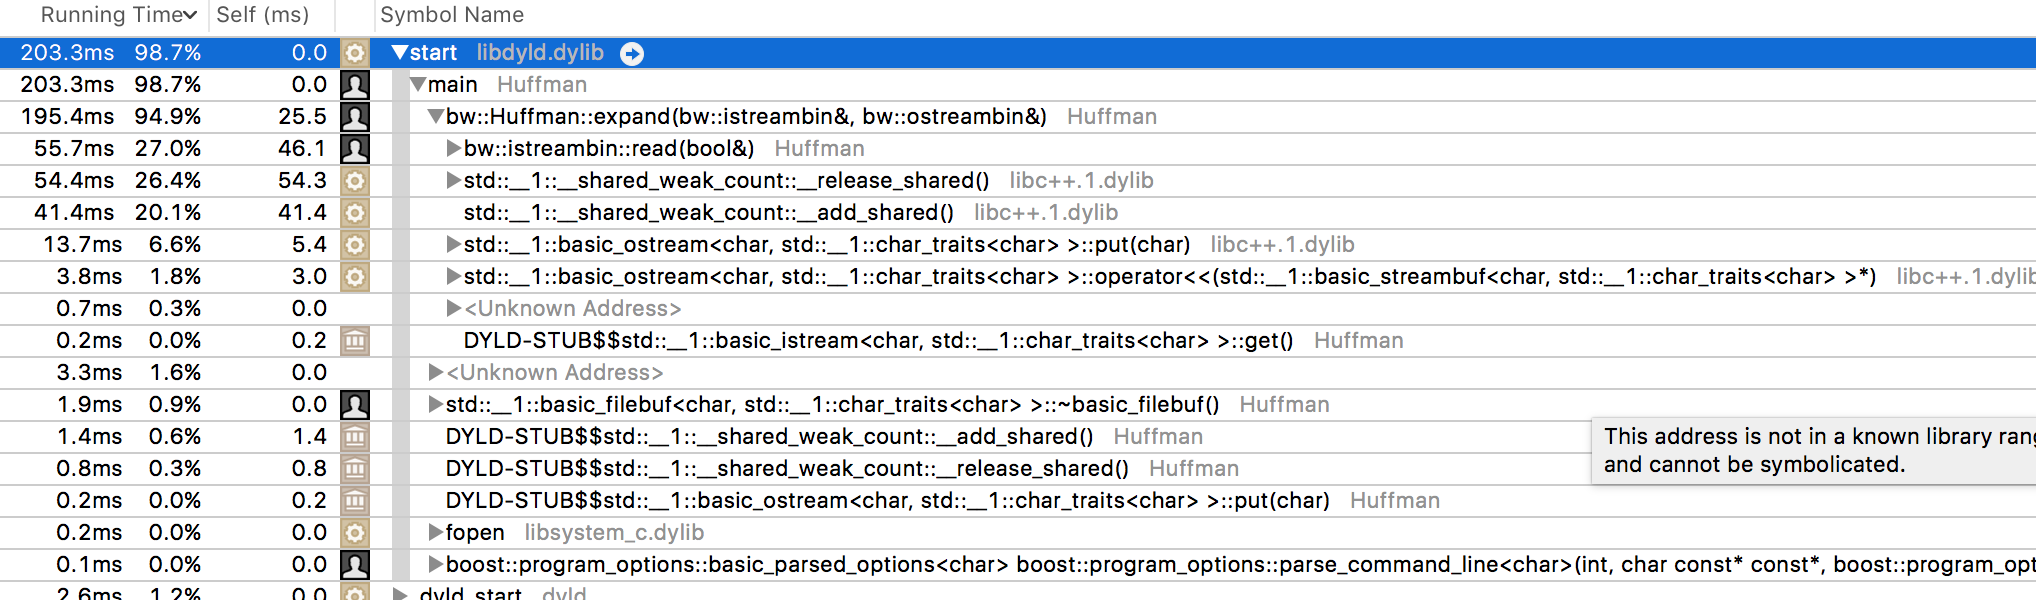
Wait! What are those __shared_weak_count::__release_shared/__add_shared calls consuming
almost half of the running time? If we take a look at the
implementation,
we see it uses std::shared_ptr to allocate
the nodes for the Huffman tree. As you might know, shared_ptr provides a
smart pointer with a thread safe, reference counted, copy semantics. The code is single
threaded, so this thread safe reference counting is a waste of resources, but the point
is that shared_ptr is thread safe, and not going to suggest to implement a single
thread version of it. What do we do? Well, a careful review on the code shows that we
actually don’t need a smart pointer with copy semantics, the pointer is never shared,
but transferred from one owner to another, so what we need is
moving semantics, and we have a perfect smart pointer
with this characteristic:
std::unique_ptr.
By replacing std::shared_ptr with std::unique_ptr, we are free
from the reference counting contention. Let’s see how fast we got
with this change:
$ time bin/Huffman -e -i mobydick.txt -o mobydick.bwc

real  0m0.107s
user  0m0.092s
sys 0m0.008s

$ time bin/Huffman -d -o mobydick.txt -i mobydick.bwc

real  0m0.120s
user  0m0.109s
sys 0m0.007s
Wow! Decompression now, compared to the original code, is 193% faster!

C++ code got a lot faster, and we achieved this with only intelligent use of the
standard C++ library, no need to implement lock free data structures, or fancy
algorithms or either special processor features. Sometimes, less is more.
If you want to take a look at the actual source code, you can visit
my pull request (there is
an extra commit reversing a flawed attempt to optimizes the code preserving std::cin).
If I was asked to try to make the code even faster, I would give
file mapping a try, since
file I/O seems to be the bottleneck here. Maybe I do that in the future, and publish the
results here.