Profiling Firefox OS apps
• mozilla, B2G
B2G has a built-in profiler that you can use to find hot spots in your app. The process is made easy by the profile.sh script, which helps you to generate a profile file for upload to the Cleopatra application.
Earlier, you had to build your own Firefox OS image to use profile.sh
tool, but that’s no longer the case. Thanks to
Snappy symbolication server,
you can grab a Mozilla nightly
image and start to investigate where your app is wasting time.
profile.sh communicates with the device through
adb, so you need to enable
it in the developer menu. You also need an
engineering build image of your device (images with -eng suffix).
In this post, I am going into the steps to get a profile stack trace for your app. In a few words, you have to follow a some steps:
-
Start the b2g process and your application with profile support.
-
Perform the actions you want to profile.
-
Capture the profiles from the device.
-
Upload profile to Cleopatra.
Starting with profile support
In general, you want to start profile support in the B2G parent process’ compositor
thread and your app. The template for this procedure is
./profile.sh start -p b2g -t Compositor && ./profile.sh start -p <your-app>.
If you don’t know the app name, you can use the profile.sh ps command to
list the B2G processes:
$ ./profile.sh ps
  PID Name
----- ----------------
  208 b2g              profiler not running
  399 (Nuwa)           profiler not running
  896 Built-in Keyboa  profiler not running
 1059 Homescreen       profiler not running
 1251 Usage            profiler not running
 2238 (Preallocated a  profiler not running
For this example, we are going to start profile for Homescreen application:
$ ./profile.sh start -p b2g -t Compositor && ./profile.sh start -p Homescreen
Process: b2g
Threads: Compositor
Using default features js,leaf,threads
Starting profiling PID 208..
Profiler started

Process: Homescreen
Using default features js,leaf
Starting profiling PID 1059..
Profiler started
You should now take your phone and perform the actions you would like to profile.
Getting profile files
Pulling profile data from the devices is performed by running
profile.sh capture command. One of the steps performed
is symbol resolution. profile capture provides the -s
option which allows you to pass the URL of the
symbolication server,
that perform symbol resolution.
For Firefox OS oficial builds, you can use the Mozilla symbolication server:
$ ./profile.sh capture -s https://symbolapi.mozilla.org
Symbols: https://symbolapi.mozilla.org
Signaling Profiled Processes: 208 1059
Stabilizing 208 b2g ...
Pulling /data/local/tmp/profile_0_208.txt into profile_208_b2g.txt
Adding symbols to profile_208_b2g.txt and creating profile_208_b2g.sym ...
Stabilizing 1059 Homescreen ...
Pulling /data/local/tmp/profile_2_1059.txt into profile_1059_Homescreen.txt
Adding symbols to profile_1059_Homescreen.txt and creating profile_1059_Homescreen.sym ...
Merging profile:  profile_208_b2g.sym profile_1059_Homescreen.sym
./gecko/tools/profiler/merge-profiles.py profile_208_b2g.sym profile_1059_Homescreen.sym

Results: profile_captured.sym
Removing old profile files (from device) ... done
The format of the pulled files is profile_PID_NAME.txt and the files with
symbols resolved have the same name but with .sym extension. It also
creates a merged file called profile_captured.sym. After that, you can
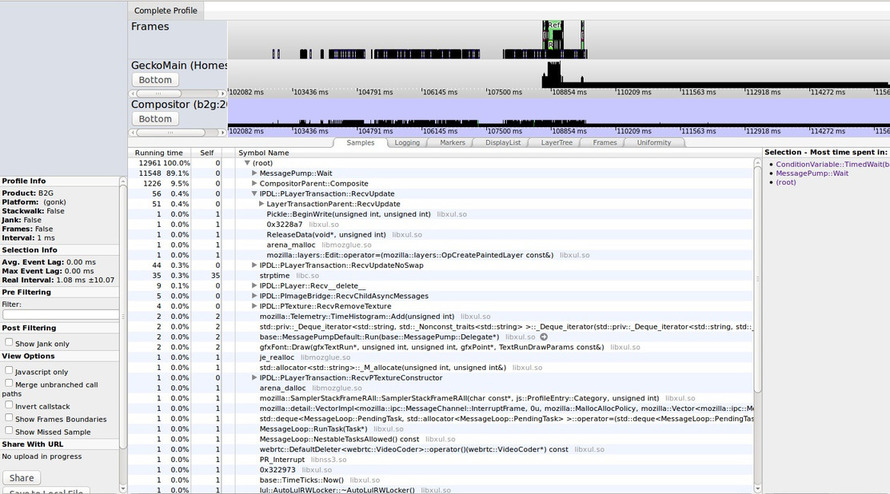
upload the results to Cleopatra:
Symbol resolution through breakpad symbols
That’s not the end of the story. Symbolication server makes use of the
google-breakpad symbol files
for symbol resolution. Firefox already uses breakpad for the crash reporting
system. When you build your own B2G image, you use the build.sh script,
and it can also be used to generate breakpad symbols:
$ ./build.sh buildsymbols
The symbols will be generated in the $GECKO_OBJDIR/dist/crashreporter-symbols
directory. The -s of the profile.sh also accepts the path to the breakpad
symbols directory for local symbol resolution, so you can also profile using
breakpad symbols:
$ ./profile.sh capture -s $GECKO_OBJDIR/dist/crashreporter-symbols/
And the profile_captured.sym file will be generated as usual.
If you distribute the breakpad symbols with your custom Firefox OS image anyone can profile it.
Conclusion
This post was intented to be a brief tutorial on how to get profiles for your app
without building your own Firefox OS image. Currently, profile.sh is shipped
with private builds only, and it will
eventually ships with Nightly too.
If you have any doubts, ping me on #fxos-automation room.